How does Search Console Insights choose the referring links from other websites?

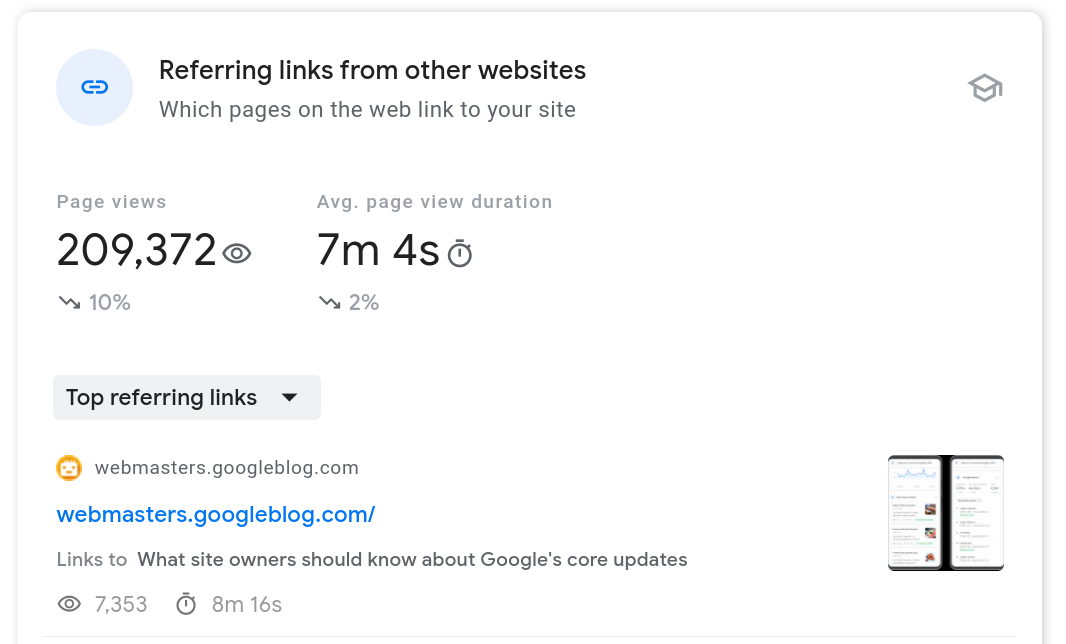
The referring links from other websites card shows how users discover your site’s content
through links to your content from other sites.
Our goal with this report is to provide you with a proxy on how many entrances were generated by a specific
referring page. On GA, when you look at traffic from a specific referral, it includes all pageviews in
the current session. On GSC Insights, for each incoming session from a specific referral, we’ll count
only one pageview; the traffic you see in this card is only a subset of the referral traffic you are used
to seeing in GA.
Note that we do not use this logic in the top traffic channels card; pageviews are usually
lower in the referring links card when compared to the Referral channel.
How can clicks be lower than pageviews in the Google Search card?
There are three main reasons for clicks being lower than pageviews:
- Each click can trigger more than a single pageview – other pageviews during the session are also attributed
to google / organic. Learn more about
the way sessions are defined and classified. - GA pageviews for google / organic include more surfaces than web search results, such as Discover,
Image Search and Video Search. - GA and GSC don’t necessarily report on the same group of pages. For example, you might have a GSC account
that includes only your HTTP pages while the GA view you chose reports on both HTTP and HTTPS.
What do the different badges in the GSC Insights cards mean?
We introduced badges on GSC Insights to help you focus your attention on interesting patterns in the data.
For now, there are three different badges:
- High avg. duration: the content has a high average duration compared to your site’s
other pieces of content. This might be content your audience found engaging. - Top 5 results: the average position on Google Search (organic) of your content
in the last 28 days for the given query is five or less. - Trending x%: represents a comparison between the last 28 days and the previous performance.
This badge is only shown when the trend is significantly greater than the general site trend.
Learn about the data, find tips, and more resources
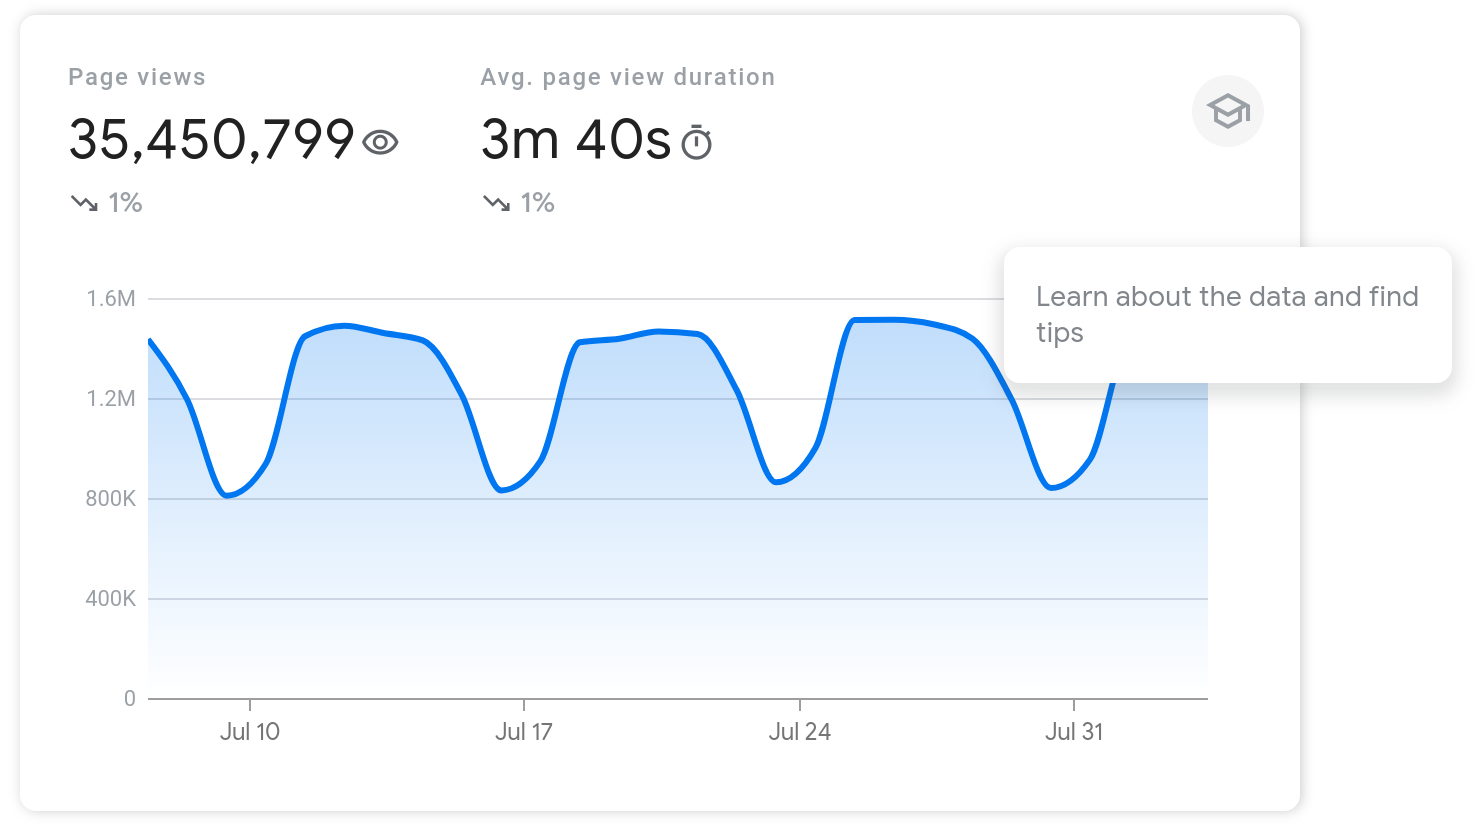
To learn more about each of the cards available on GSC Insights, click the little hat, as shown in the
screenshot below. There, you’ll find more context about the data, and tips on how to interpret it. For
example, there are short descriptions of what a change in the chart means and definitions of the metrics
used in charts and tables.

If you have any questions or feedback, click the send feedback button available on GSC Insights,
reach out to us on Twitter, or post a
question in the
Search Central community.
Send feedback
Except as otherwise noted, the content of this page is licensed under the Creative Commons Attribution 4.0 License, and code samples are licensed under the Apache 2.0 License. For details, see the Google Developers Site Policies. Java is a registered trademark of Oracle and/or its affiliates.
[{
“type”: “thumb-down”,
“id”: “missingTheInformationINeed”,
“label”:”Missing the information I need”
},{
“type”: “thumb-down”,
“id”: “tooComplicatedTooManySteps”,
“label”:”Too complicated / too many steps”
},{
“type”: “thumb-down”,
“id”: “outOfDate”,
“label”:”Out of date”
},{
“type”: “thumb-down”,
“id”: “samplesCodeIssue”,
“label”:”Samples / code issue”
},{
“type”: “thumb-down”,
“id”: “otherDown”,
“label”:”Other”
}]
[{
“type”: “thumb-up”,
“id”: “easyToUnderstand”,
“label”:”Easy to understand”
},{
“type”: “thumb-up”,
“id”: “solvedMyProblem”,
“label”:”Solved my problem”
},{
“type”: “thumb-up”,
“id”: “otherUp”,
“label”:”Other”
}]
Need to tell us more?

